
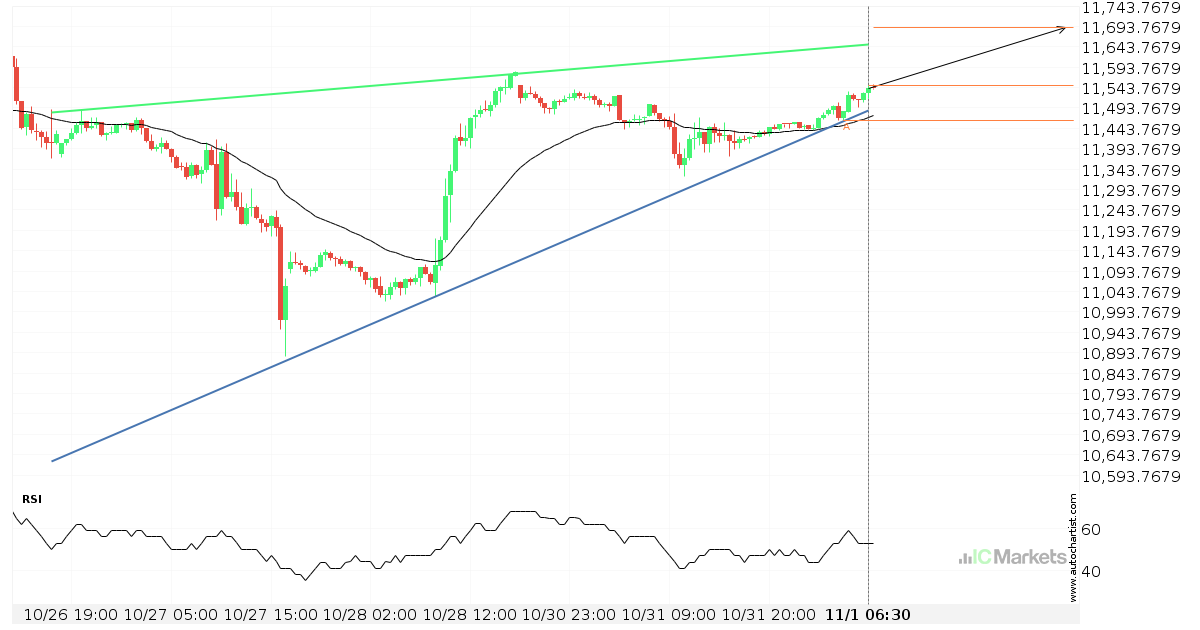
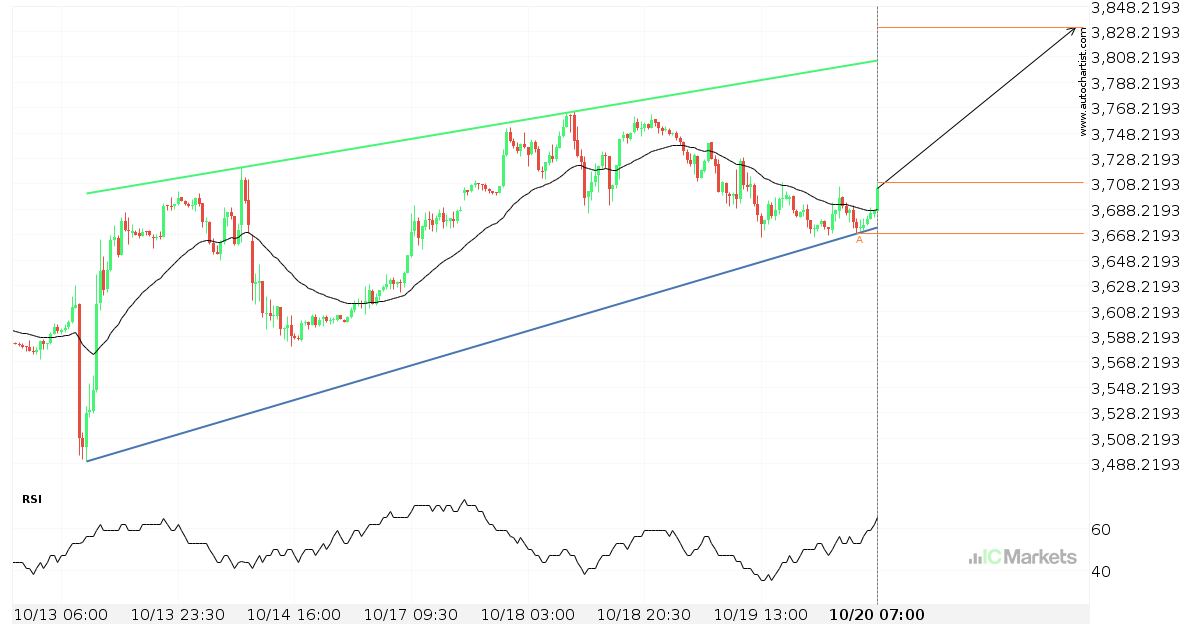
¿Tendrá el US Tech 100 Index suficiente impulso como para irrumpir la resistencia?
El US Tech 100 Index se dirige hacia la línea de resistencia de un Cuña ascendente y puede alcanzar este punto en las próximas 2 días. Ha probado esta línea ya en numerosas ocasiones en el pasado, y esta vez no tendría porqué ser diferente y terminar con una recuperación en lugar de una irrupción. […]
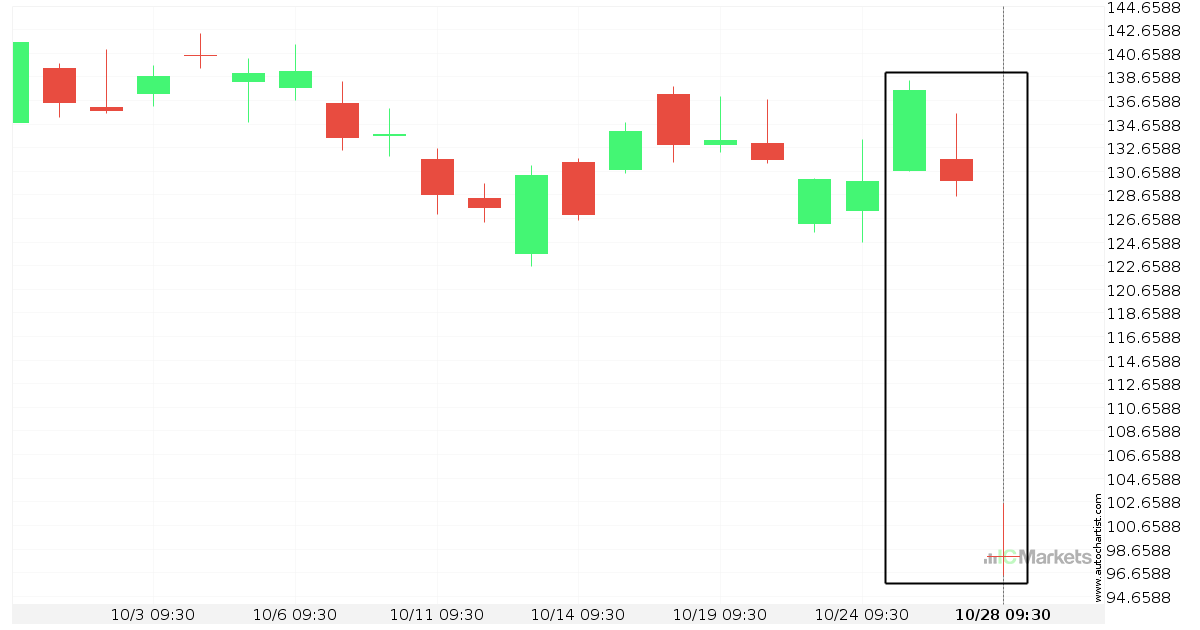
El Meta Platforms, Inc. – Class A Common Stock está en dirección down
El Meta Platforms, Inc. – Class A Common Stock ha experimentado un excepcional movimiento descendente de un 28,74% de 137.46 a 97.955 en 4 días.
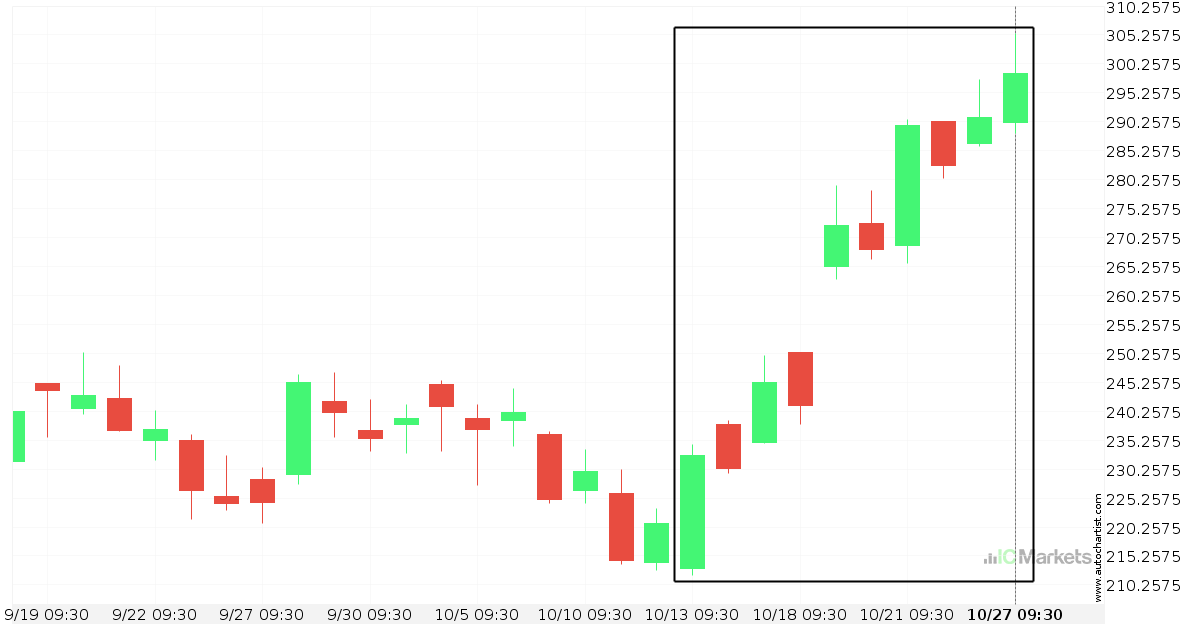
Extraordinario movimiento alcista del Netflix Inc.
El Netflix Inc. ha ascendido un 28,42% de 232.53 a 298.61 en 15 días.
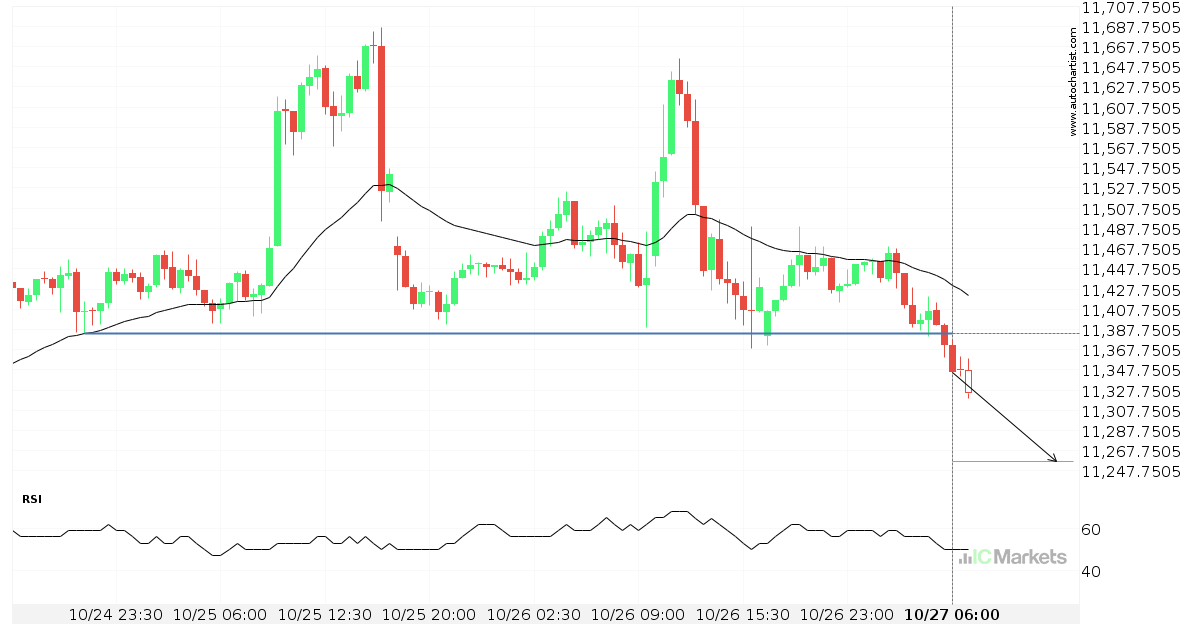
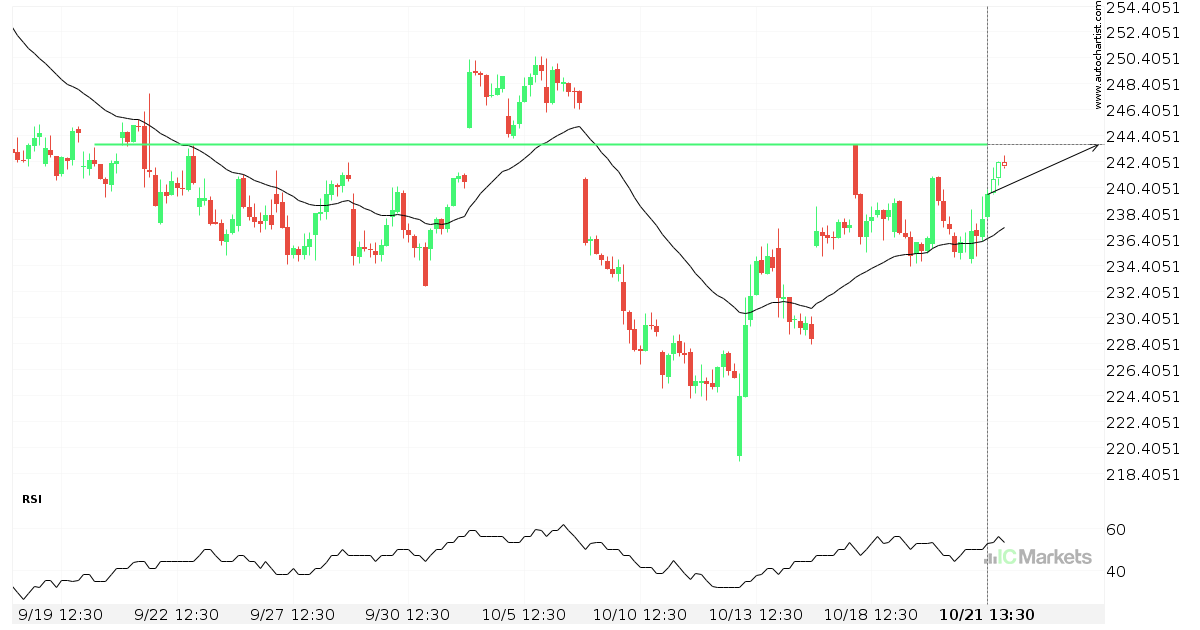
Importante línea de precio atravesada por el US Tech 100 Index
El US Tech 100 Index ha atravesado 11384.0000, que ha probado ya varias veces en el pasado. Ya hemos visto un retroceso de esta posición en numerosas ocasiones. Si esta nueva tendencia persiste, US Tech 100 Index podría dirigirse al nivel 11257.2900 dentro de las próximas 12 horas.
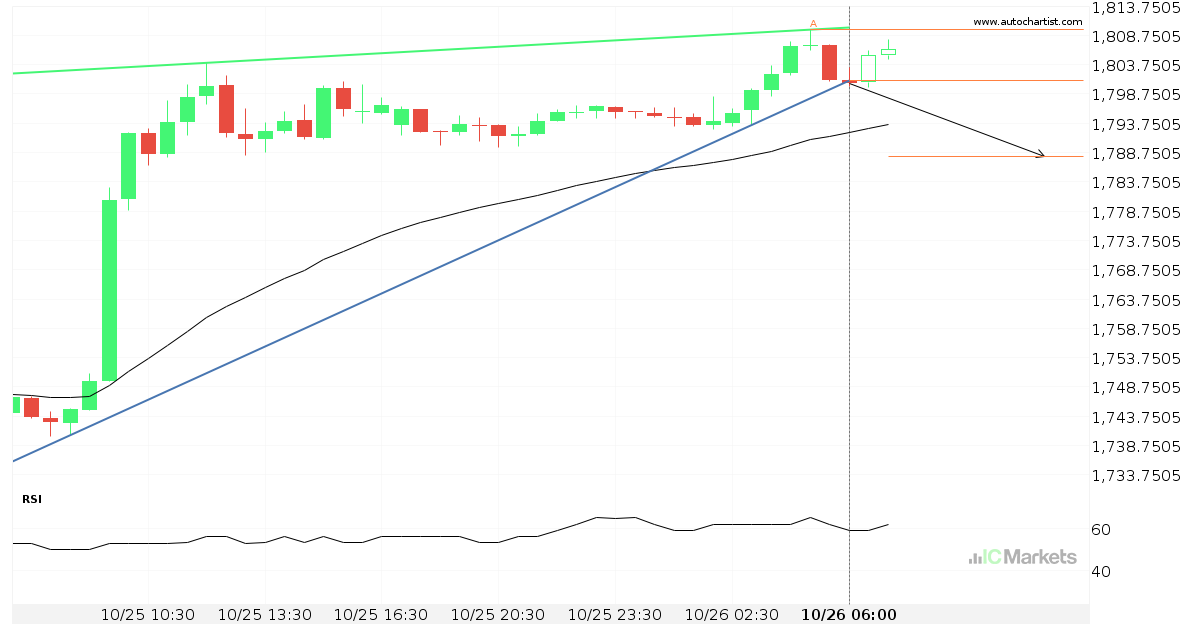
Un posible comienzo de una tendencia bajista en el US Small Cap 2000 Index
El US Small Cap 2000 Index ha atravesado una línea de soporte de un patrón de gráfico que corresponde a un Cuña ascendente. Si esta irrupción se mantiene, podríamos ver el precio del US Small Cap 2000 Index probando el nivel de 1788.0672 dentro de las próximas 5 horas. Pero no se apresure si desea […]
Posible ruptura del nivel de soporte en el US Small Cap 2000 Index
El US Small Cap 2000 Index avanza hacia la línea de soporte de un Canal bajista, que ya ha probado varias veces en el pasado. Hemos visto un retroceso antes desde esta línea, así que en esta etapa no está claro si atravesará esta línea o se recuperará como lo ha hecho anteriormente. Si el […]
Microsoft Corporation – se acerca a la línea de precio psicológico
El Microsoft Corporation avanza hacia la línea de resistencia de un Resistencia. Como lo hemos observado retrocediendo desde este nivel en el pasado, podríamos observar, o bien una ruptura a través de esta línea o una recuperación de nuevo a los niveles actuales. Ya ha llegado a dicha línea en numerosas ocasiones durante los últimos […]
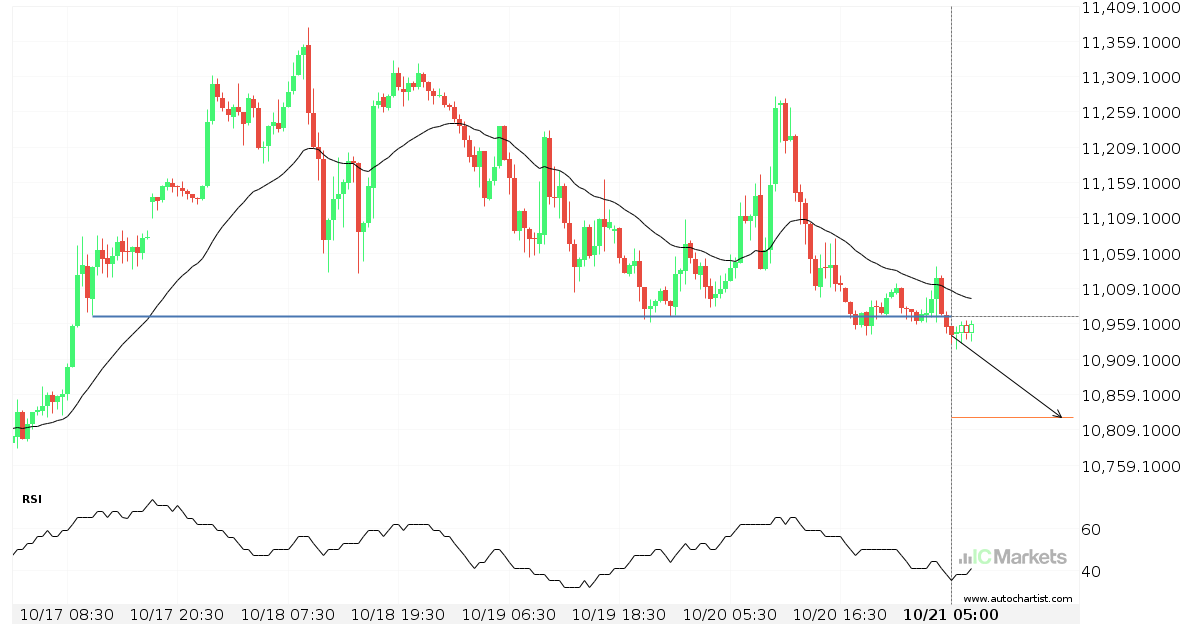
Importante línea de precio atravesada por el US Tech 100 Index
El US Tech 100 Index ha atravesado 10968.9004, que ha probado ya varias veces en el pasado. Ya hemos visto un retroceso de esta posición en numerosas ocasiones. Si esta nueva tendencia persiste, US Tech 100 Index podría dirigirse al nivel 10826.0703 dentro de las próximas 19 horas.
Posible ruptura del nivel de resistencia en el US SPX 500 Index
El US SPX 500 Index avanza hacia la línea de resistencia de un Cuña ascendente, que ya ha probado varias veces en el pasado. Hemos visto un retroceso antes desde esta línea, así que en esta etapa no está claro si atravesará esta línea o se recuperará como lo ha hecho anteriormente. Si el US […]
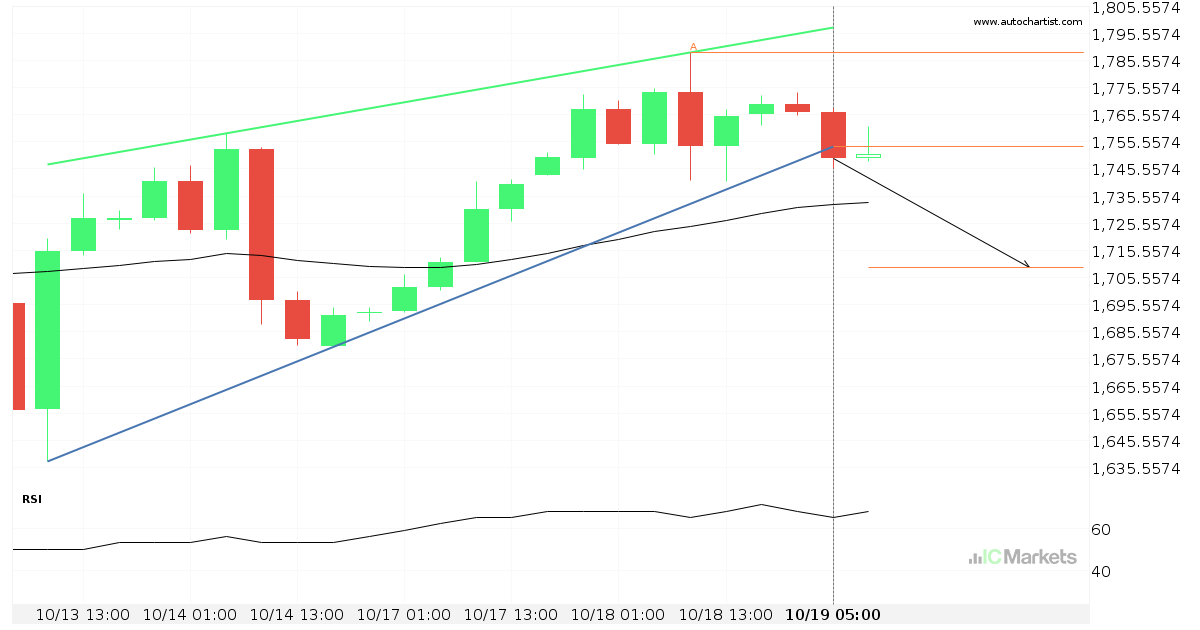
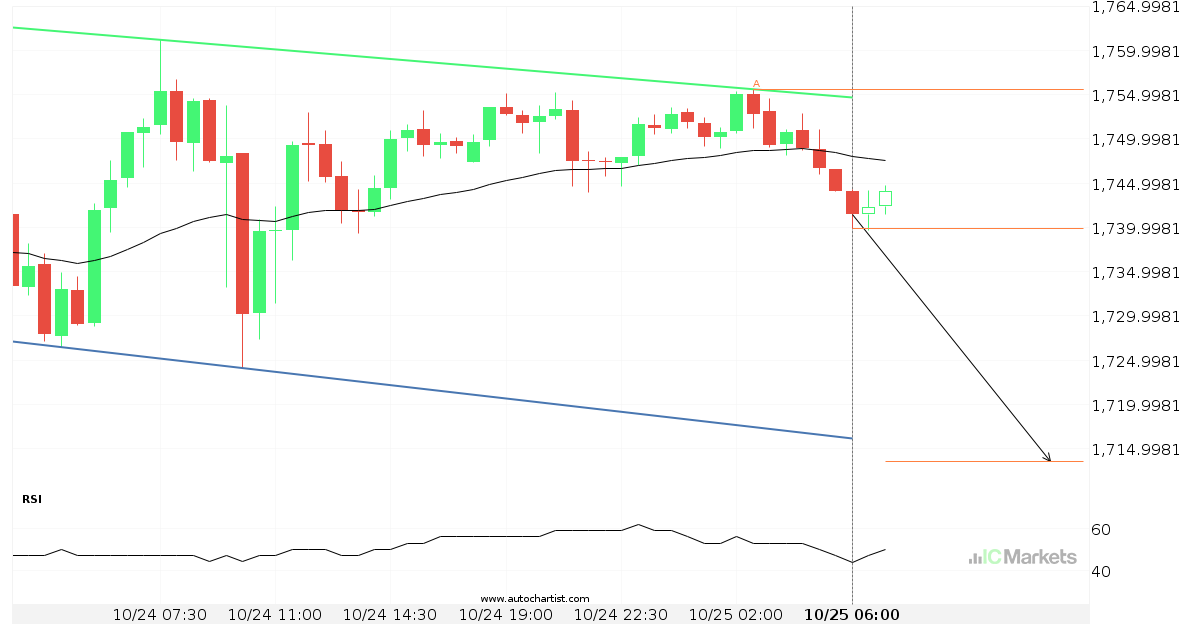
La línea de soporte ha sido irrumpida por el US Small Cap 2000 Index
El US Small Cap 2000 Index ha atravesado la línea de soporte, que ya se ha probado dos veces en el pasado. Hemos visto, anteriormente, un retroceso desde esta posición, así que debemos esperar la confirmación de la ruptura antes de operar. Si esta nueva tendencia persiste, un nivel objetivo alrededor de 1709.2306 podría materializarse […]